On December 1, 2008, the National Bureau of Economic Research finally made it official: the United States had entered a recession a year earlier—in December 2007. This is the thirteenth U.S. recession since the Great Depression of 1929-33 (see Table 1). At over thirteen months of age, it’s also a relatively long-lived slump. Indeed, it’s almost as long as the two longest post-Great Depression recessions. Both lasted sixteen months.

A simplistic reading of the historical record suggests that the current slump is longer than average and is ready to expire. But things are never that simple. Most recessions since the Great Depression have been caused by the Federal Reserve applying its monetary brakes to rein in inflation. The current episode is different. This time an ultra-loose credit stance by the Fed spawned an excessive accumulation of debt, a ratcheting up of leverage, and unsustainable increases in asset prices. The resulting house of cards finally came tumbling down.
As I explained in “The Credit Triangle” (GlobeAsia, January 2009), the great unwinding of debt has set in motion a giant battle between the private sector credit system and the central bank.
The accompanying credit triangle depicts the broad outlines of the battle (see Chart 1). The upper layers of the triangle represent slices of the private sector credit system. Since the crisis erupted, entities in these layers have been scrambling to deleverage and shrink their balance sheets. In consequence, downward pressure has been exerted on the triangle, reducing the supply of credit.

The Federal Reserve has aggressively attempted to counteract the contraction of private credit by more than doubling the size of its balance sheet since August 2008. The central bank provides reserves to banks and currency to the non-bank public. Through the magic of the fractional reserve banking system, the Fed’s highpowered money is multiplied into $8.3 trillion in deposit liabilities held at banks.
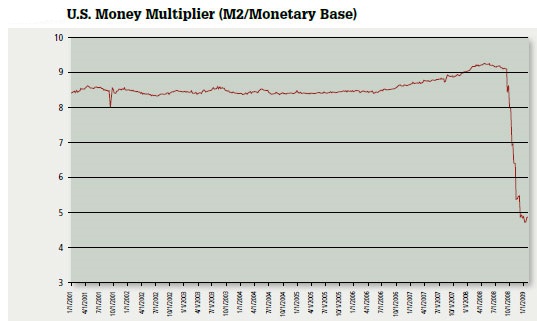
The unprecedented explosion in the Fed’s balance sheet has resulted in a surge in the money supply. For example, since last December, the M2 metric for money supply has been increasing at a 23% annual rate. More importantly, the U.S. money multiplier (M2 / “high powered money”) has, after plunging, stabilized and begun to creep up (see Chart 2). The upper hand in the battle between the deleveraging private sector credit system and the leveraged up central bank appears to have switched from the private sector to the central bank. The credit triangle appears to have been stabilized. If so, the U.S. might be close to the bottom. While the duration of the current slump will break the post-Great Depression record, it probably won’t extend the record by many months.

Contrary to the alchemists that turn potential good news into bad, there are indications that the slide in the U.S. economy is moderating and that we are approaching the end of the slump. One reliable metric is the Federal Reserve Bank of Chicago’s National Activity Index. The index measures the change each month in eighty-five indicators. A value of zero signals that the economy is growing in line with long-term trends. Positive and negative readings signal above and below trend growth rates, respectively. While the current reading is negative, it is less so than in September 2008 (see Table 2).

The yield on the government 10-year bond has also jumped by almost 90 basis points from its low in December 2008. This increase implies a change in expectations toward more real growth, inflation, or some combination of both. Existing home sales are also up from their November 2008 lows, indicating that prices have fallen enough to motivate more transactions and move inventory. Commodity prices, a most sensitive metric, bottomed out in December 2008. Since then, the Commodity Research Bureau’s index, which contains twenty-three commodities, is up by 5.33%. The most dramatic turnaround has been in the Baltic Dry index, which has more than doubled since December 2008.
This volatile index is important because it is a benchmark for freight costs for dry bulk commodities—like iron ore, coal and grains. It jumped during the five-day visit of China’s premier Wen Jiabao to Europe. Significantly, Mr. Wen said that “confidence is the most important thing, more important than gold or currency.” He then proceeded to go on a $15 billion spending spree, signing contracts for commodities and equipment in an attempt to “help us restore and shore up confidence in the market.” Mr. Wen was firing real “bullets.”
After being crushed in the last quarter of 2008, the most likely scenario for 2009 points to a significant commodity price snapback. An economic turnaround at mid-year—with growth, but growth below trend—will push commodity prices, including gold, higher.
In addition, after dramatic drops in the price of most commodities relative to the price of gold, we should anticipate that those commodity prices (relative to gold) will tend to revert back to their historical norms. They always do after a dramatic departure from the “golden constant.”
With a snapback in commodity prices, inflation expectations and general measures of inflation will become more elevated. And with that, the Federal Reserve will begin to put on the brakes. Quantitative easing will end, the Fed will begin to dump assets to slim down its balance sheet, and interest rates will rise. This will, of course, jeopardize the recovery. With that scenario, the prospective path for the economy might best be described as W-shaped. What a thought!
Author Steve H. Hanke

0 responses on "A Commodity-Price Snapback?"