To address the problems associated with rising food prices, we must understand what has caused prices to rise. This report identifies a major cause of the rise in food and other commodity prices since 2001: a weak U.S. dollar.
The evidence suggests that the Federal Reserve is a major culprit in the commodity inflation story. But you wouldn’t know it from reading the press or listening to officialdom and the political chattering classes. This isn’t surprising. After all, economic history is written, to a large extent, by central bankers. In consequence, one should take official accounts with a large dose of salt.
When charged with blowing bubbles, all Fed officials-from former chairman Alan Greenspan to chairman Ben S. Bernanke-proclaim their innocence. Let’s look at the evidence.
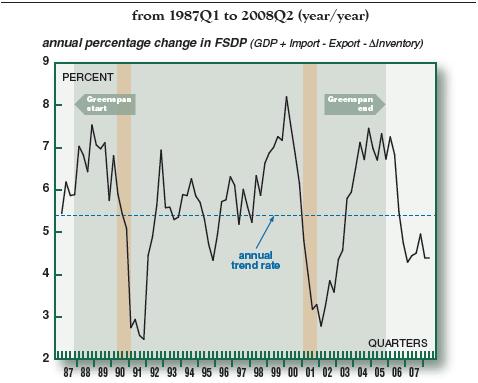
What is a bubble? A bubble is created when the Fed’s laxity allows aggregate demand to grow too rapidly. Specifically, a demand bubble occurs when nominal final sales to U.S. purchasers (GDP – exports + imports – change in inventories) exceeds a trend rate of nominal growth-a trend rate that is consistent with “moderate” inflation- by a significant amount.
During Greenspan’s 18-year tenure as Fed chairman, nominal final sales grew at a 5.4% annual trend rate. This reflects a combination of real sales growth of 3% and inflation of 2.4% (Figure One). But there were deviations from the trend.
The first deviation began shortly after Greenspan became chairman. In response to the October 1987 stock market crash, the Fed turned on its money pump and created a bubble: over the next year, final sales shot up at a 7.5% rate, well above the trend line. Having gone too far, the Fed then lurched back in the other direction. The ensuing Fed tightening produced a mild recession in 1991.
From 1992 through 1997 growth in the nominal value of final sales was quite stable. But successive collapses of certain Asian currencies, the Russian ruble, the Long Term Capital Management hedge fund and finally the Brazilian real triggered another excessive Fed liquidity injection. This resulted in a boom in nominal final sales and a bubble in 1999-2000. This was followed by another round of Fed tightening, which coincided with the bursting of the equity bubble in 2000 and a slump in 2001.
Figure One
Final Sales to Domestic Purchasers (FSDP) 
The last big jump in nominal final sales was set off by the Fed’s liquidity injection to fend off the false deflation scare in 2002. Fed Governor Ben S. Bernanke (now chairman) set off a warning siren that deflation was threatening the U.S. economy when he delivered a dense and noteworthy speech, “Deflation: Making Sure it Doesn’t Happen Here,” on November 21, 2002.1 He convinced his Fed colleagues that the deflation danger was lurking. As Greenspan put it, “We face new challenges in maintaining price stability, specifically to prevent inflation from falling too low.”2 By July 2003, the Fed funds rate was at a record low of 1%, where it stayed for a year. This produced the mother of all liquidity cycles and yet another massive demand bubble.
During the Greenspan years, and contrary to his claims, the Fed overreacted to real or perceived crises and created three demand bubbles. The last represents one bubble too many- and one that is impacting us today.
Not surprisingly, the mother of all liquidity cycles was accompanied by a weak dollar. Indeed, the Federal Reserve’s Trade Weighted Exchange Index fell by 26% from December 28, 2001 to mid-July 2008. And as every commodity trader knows, all commodities, to varying degrees, trade off changes in the value of the dollar. When the value of the dollar falls, the nominal dollar prices of internationally traded commodities-like gold, rice, corn and oil-must increase because more dollars are required to purchase the same quantity of any commodity. Accordingly, a weak dollar should signal higher commodity prices. And it has. Since 2001, when the dollar started its downward slide, until mid-July 2008, the fifty-five commodities that make up the Food and Agricultural Organization of the United Nation’s “Food Price Index” have increased by 127%.
To examine the link between the greenback and commodity prices, a counterfactual-a what if, thought experiment- is well suited. Counterfactuals are often employed to examine alternatives to actual history. For example, what would have happened if, contrary to fact, some present condition were changed?
The use of counterfactuals has a rich, if not controversial, history. Perhaps the most famous counterfactual was employed by Professor Robert Fogel of the University of Chicago in Railroads and American Economic Growth.3 In that book, Professor Fogel calculated what the transportation system of the United States in 1890 would have looked like without railroads. His calculations created a great controversy. But they were robust and helped him win the 1993 Nobel Prize in Economics.
Table One
Counterfactual: The Contribution of the Weak Dollar to Commodity Price Increases 

Table 1 contains the results of counterfactual calculations. By computing what the prices of various commodities would have been on July 11, 2008, if the U.S. dollar-euro exchange rate would have remained the same as it was on December 28, 2001, we can determine (on a counterfactual basis) what the exchange-rate (weak dollar) contribution to the total change in various commodity prices has been in the period under study. For example, rough rice prices have increased by 385%, and the weak dollar has contributed 55.53% to the price increase of rough rice. In the case of rough rice, real factors (supply and demand fundamentals) have also contributed to the price increase in the period under study-namely 44.47%. This is signified by a “+” sign in the last column of Table 1 for rough rice.
Lean hogs are at the other end of the spectrum. If the dollar-euro exchange rate would have remained at its December 28, 2001 level, the price of lean hogs would have declined from57.05 cent/lbs. to 41.74 cent/lbs. during the December 28, 2001-July 11, 2008 period. In fact, the price of lean hogs was 74.65 cents/lbs. on July 11, 2008. Accordingly, the exchange-rate contribution to the change in the price of lean hogs in the period under study was 186.98%. This contribution exceeds 100% because real factors were working to depress the price of lean hogs, and that is why a “-” sign is entered in the last column for lean hogs.
Table Two
Changes in the Value of the Dollar and Commodity Prices 
Given the dollar’s recent upsurge in value, we don’t have to rely solely on a counterfactual thought experiment to show how nonsensical “Fedspeak” can be. As Table 2 indicates, the dollar has appreciated against the euro by 6.9% during the July 11-August 11, 2008 period. With the exception of live cattle and lean hogs, the prices of all commodities listed have fallen. And the CRB Foodstuffs and Spot Indexes have fallen by -7.12% and -6.31%, respectively, during the period in question. That’s almost a perfect mirror image of the dollar’s strength.
Contrary to Fed chairman Bernanke’s Semiannual Monetary Policy Report to the Congress, which he delivered on July 15, 2008,4 the weak dollar has played a significant role in pushing up food and commodity prices. If the dollar continues to strengthen, it will provide relief from sky-high food and commodity prices.
In closing, let us address the price of crude oil-an important input in the production and distribution of food. In the December 28, 2001-July 11, 2008 period, the weak dollar contributed almost $64 per barrel to the total rise in the price of oil. A stronger dollar would put considerable downward pressure on crude oil prices. In addition, the U.S. government’s Strategic Petroleum Reserve could be transformed from a “dead” resource into a dynamic, market-based force. This, too, would put downward pressure on crude prices.
The SPR is a response to the oil embargo imposed by the Organization of Arab Petroleum Exporting Countries after the 1973 Arab-Israeli War. It comprises five underground storage facilities, hollowed out from salt domes, located in Texas and Louisiana. By 2005, the SPR’s capacity reached its current level of 727 million barrels. At present, 706.8 million barrels are stored in the SPR. That’s over twice the size of private crude oil inventories. To put SPR’s size into perspective, its current storage would cover about 71 days of U.S. crude oil imports or 47 days of total U.S. crude oil consumption.
The SPR’s drawdown capacity is 4.3 million barrels per day. That rate is slightly greater than the combined daily crude oil exports from Iran and Kuwait. In short, the SPR is huge.
Not being faced with capital carrying charges and never wanting to be caught short, government officials, like proud pack rats, want to just sit on this mother of all commodity hoards. They argue that the SPR represents an insurance policy for national emergencies. But without a specified release rule, just what is the insurance policy written for?
What should be done with the hoard of crude oil in the SPR? It’s time to remove the SPR’s “fill” and “release” rules from the grip of politics. Market-based release rules would transform the SPR into an oil bank. It would provide the country with a huge precautionary inventory of oil, generate revenue to defray some of the government’s stockpiling costs, smooth out crude oil price fluctuations, and push down spot prices relative to prices for oil to be delivered in the future. It would also force the government to “buy-low” (when crude oil is plentiful) and “sell-high” (when crude is scarce).
How would the oil bank work? To implement a “sell-high” release rule, the government should sell out of the money covered call options on the SPR stockpile. It might, say, sell December 2008 call options with a strike price of $150 a barrel. If the price surged above that level, the option buyer would exercise the option and take delivery of crude oil from the government’s stockpile. If the price never reached $150, the option would expire worthless and no crude oil would be released.
To implement a “buy-low” fill rule, the government should sell out of the money put options.5 It might, say, sell December 2008 put options at $70 a barrel. If the price fell below $70, the option buyer would exercise the option and sell crude to the government for delivery to the SPR.
If we want lower oil prices, we can obtain them immediately by replacing politically-based fill and release rules for the SPR with market-based rules.
- Ben S. Bernanke, “Deflation: Making Sure “It” Doesn’t Happen Here”, Remarks by Governor Ben S. Bernanke Before the National Economists Club, Washington, D.C., November 21, 2002.
- Alan Greenspan, Federal Reserve Board’s semiannual monetary policy report to the Congress, Testimony of Chairman Alan Greenspan before the Committee on Financial Services, U.S. House of Representatives, Washington, D.C., July 15, 2003.
- Robert W. Fogel, Railroads and American economic growth: essays in econometric history,Baltimore: The Johns Hopkins Press, 1970.
- Ben S. Bernanke, Semiannual Monetary Policy Report to the Congress, Testimony of Chairman Ben S. Bernanke before the Committee on Banking, Housing, and Urban Affairs, U.S. Senate, July 15, 2008.
- I thank Prof. Ronald McKinnon of Stanford University for prompting me to include a fill rule.
Author Steve H. Hanke

0 responses on "The Greenback and Commodity Prices"