In the wake of an extreme economic event, such as the Panic of 2008, everyone wants to know where we are going. To get a handle on that, we must understand where we have been. The ability to interpret and understand economic data in terms of patterns, relationships, connections and structures that are likely to prevail in the future is critical if we are to make sound economic decisions today.
Accurate topological patterns — in short, good diagrams — hold the keys to developing useful images of the future.
To that end, a series of diagrams that depict the US economy from 1929 through the third quarter of 2009 are presented here. The diagrams show the relationship between the unemployment rate and the gap between profit and interest.
This important, but neglected, relationship was first analyzed by my former professor, Kenneth Boulding (1910-1993).
Prof. Boulding reasoned that businesses would tend to hire workers when there was an increasing gap between expected profit and interest.
With an increasing gap, the profit rate associated with a new hire would be increasing relative to the cost of interest. Alternatively, if the profit-interest gap is decreasing (or negative, as it was during the Great Depression) a business would have an incentive to reduce its labor force because the cost of interest is rising relative to the rate of profit.
The scatter diagrams are what Prof. Boulding called “time scatters.” Each point in a time scatter represents the magnitude of two variables and is connected by arrows showing the time sequence in which the points occur.

The first time scatter is for the 1929-44 period. The profit-interest gap is the ratio of profit as a portion of national income to profit plus interest as a portion of national income. This PIG ratio is shown in percentage terms on the horizontal axis.
The unemployment rate is displayed on the vertical axis. With the onset of the Great Depression, the PIG ratio collapsed, becoming negative in 1932. A dramatic surge in unemployment was associated with the collapsing PIG ratio.
In 1933, the PIG ratio began to improve and so did the employment picture. The recession of 1937-38 shows up as a clockwise loop in the time scatter.
The general pattern is very clear and consistent with economic theory: changes in the PIG ratio and the unemployment rate are negatively correlated.

The next scatter diagram shows the picture for the 1944-61 period. Although it contains several clockwise loops and appears a bit messier than the first diagram, it is also consistent with the theory. Again, the loops are associated with recessions: 1945, 1948-49, 1953-54, 1957-58 and 1960-61.

The general pattern in the diagram for the 1961-87 period is also very clear. Changes in the PIG ratio and changes in the unemployment rate are negatively correlated, with clockwise loops being associated with the recessions of 1969-70, 1973-75, 1980 and 1981-82.

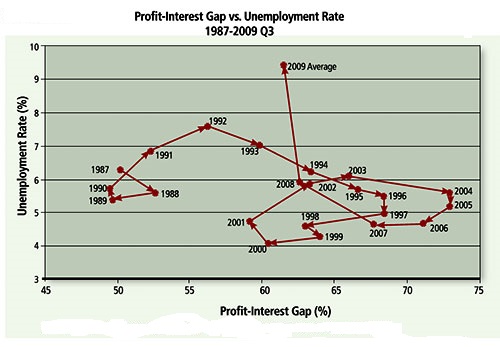
The last, and most contemporary, time scatter (1987-2009 Q3) is the most difficult to interpret. While the general relationship between the PIG ratio and the unemployment rate holds (when connected, the data points slope downward from left to right), there are anomalies.
For example, during the mild recessions of 1990-91 and 2001, unemployment rates rose, even though the PIG ratios improved. And during the 1996-2000 boom, the PIG ratios deteriorated, but the unemployment rates fell steadily.
If the economic picture in the United States is to improve, the profit-interest gap, or PIG ratio, must improve. Either profits as a portion of national income must rise or the interest portion must decline.
A decline in the interest portion is not likely. After all, interest rates are already at rock-bottom levels. The Federal Reserve has dramatically expanded the supply of high-powered money at virtually no cost to borrowers since 2008.
Alas, these funds are not flowing to consumers and businesses but rather to the banks, which are reluctant to lend to households. The households have lately shown more of a penchant for saving than borrowing anyway.
In the private sector, borrowers who leveraged up during the credit boom are attempting to repair their balance sheets.
The resulting net repayment of loans and weak demand for credit show up on the asset side of the financial institutions’ balance sheets.
In essence, this is a credit contraction, and it has engendered extremely slow growth in broad measures of the money supply.
In consequence, the money multiplier, or the ratio of broad money (M2) to high-powered money (M0), has fallen like a stone. (M2 includes currency plus demand and time deposits; M0 is just currency plus reserves on deposit at the Fed.)
In July 2008, before the collapse of Lehman Brothers, the multiplier was just above nine; it’s now four.
Sparked by de-leveraging, the sharp drop in the money multiplier signifies why the economy is not booming: The economic mechanism that transforms the Fed’s high-powered money into deposits and bank loans is stalled.
If the monetary channel can’t be counted on to improve the PIG ratio, what about fiscal policy?
The government’s fiscal house is in such disarray that confidence has been shattered. In consequence, what was intended as a fiscal stimulus has turned into a fiscal drag. The fiscal channel is blocked, too.
Add to these problems the Obama administration’s decided dislike of profits and you can throw cold water on a rapid and significant improvement in the profit-interest gap and consequently the unemployment picture in the United States.
Author Steve H. Hanke

0 responses on "The Profit-Interest Gap"