In the wake of the panic of 2008, finger pointing has become fashionable. According to some left-wing elements in the chattering classes, the free-market, entrepreneurial capitalist system caused the economic crisis. In the United States, politicians have jumped on this bandwagon. Representative Barney Frank, the colorful chairman of the powerful House Financial Services Committee, put it this way: “This is the end of the era of extreme laissez-faire, of ‘Don’t tax it, don’t regulate it.’ That has now been totally evaporated.” Pundits have also swung into action. For example, New York Times columnist Paul Krugman wrote: “For the more one looks into the origins of the current disaster, the clearer it becomes that the key wrong turn — the turn that made crisis inevitable — took place in the early 1980s, during the Reagan years.”
To get a handle on these claims, a misery index reading for each U.S. administration since World War II is presented in the accompanying chart. The original misery index was developed by the late Arthur Okun, a distinguished economist who served as chairman of the President’s Council of Economic Advisers in the Johnson administration. Okun’s index equals the sum of the inflation and unemployment rates.
While Okun’s index measures the absolute level of “misery” in the economy, it tells us little about whether things are getting better, or worse. In Getting It Right (1996), Harvard professor Robert Barro amended the Okun index. Barro’s index, which measures the change in misery during a president’s term, is the sum of the following four metrics: the difference between the average inflation rate over a president’s term and the average inflation rate during the last year of the previous president’s term; the difference between the average unemployment rate over a president’s term and the unemployment rate during the last month of the previous president’s term; the change in the 30-year government bond yield during a president’s term; and the difference between the long-term, trend rate of real GDP growth (3.1%) and the real rate of growth during a president’s term.
")
click on chart for larger view
These modifications had several effects; the data were smoother and more comprehensive, painting a more accurate picture of economic conditions experienced by the majority of Americans. They also allowed Barro to measure more accurately the relative change in the economy over the four years of a presidential term.
The data in the misery index chart speak loudly. Contrary to left-wing dogma, the Reagan “free-market years,” were very good ones. And the Clinton years of Victorian fiscal virtues – when President Clinton proclaimed in his January 1996 State of the Union address: “the era of big government is over” – were also very good ones.
")
click on chart for larger view
The misery index pours cold water on the current critique of free markets – one that has taken on the characteristics of a religion that is embraced without investigation. Indeed, it makes one wonder if the critics tested their ideas by comparing them with anything that actually happened. To obtain an economic reality check, the misery index concept can be applied to any country where suitable data exist. Let’s take a look at Indonesia.
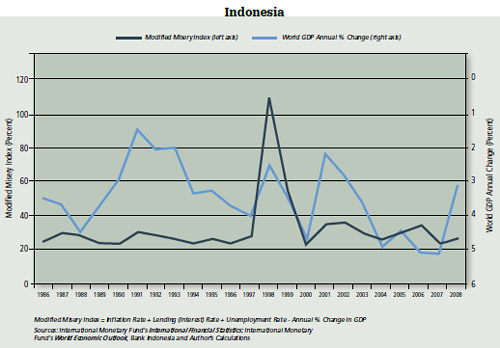
A modified misery index – using all four of Barro’s metrics for the last two decades in Indonesia – is presented in the accompanying chart. The index is a simple sum of interest, inflation, and unemployment rates, minus year-on-year GDP growth. Most apparent in the chart is a large jump during the Asian financial crisis of 1997 and 1998. The index normalizes quickly by 1999, however. Indeed, it made new lows during the next decade. While Indonesia’s economy follows the rhythms of the world economy, it is evident that Indonesia has experienced little improvement in basic levels of economic “misery” during the past twenty years. Successive administrations have failed to significantly bring misery rates down to the levels of Western economies, as many of their regional peers have done. There remains quite some distance to be traveled.
As an indication of just how far, consider that Indonesia ranks 129 out of the 181 countries ranked in the World Bank’s Doing Business 2009 – a report that measures the vitality of free markets and the ease of doing business.
Author Steve H. Hanke

0 responses on "The Misery Index: A Reality Check"